

Just as a matter of making publicly-available (but not always highly publicized) information on the operations of the United Nations accessible to all of my colleagues, readers, followers and the occasional accidental tourist to The Internationalist Page Blog site, I thought it would be of benefit to take a good look at where the UN's money is invested. This information sometimes provides very, very valuable clues into which countries and causes carry the most clout with this august body of brilliance [I tend to be sarcastic, but I am making a conscious effort to cut back a bit], and which parties have the best lobbying access to its international purse strings.
Please be fully at liberty to draw whatever conclusions you wish from the data set forth in the table embedded in the article below, which appears courtesy of the U.K. Guardian, a superb publication upon which many Internationalists and Global Futurists as well as business leaders have come to rely:
-----------------------------------------------
Who's doing business with the UN? – get the data
Developing
and emerging economies, led by India and Russia, are winning a growing
share of UN business but American companies still dominate.
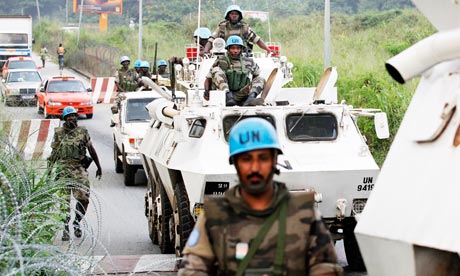
UN peacekeeping forces in Ivory Coast. Which countries are doing the most business with the UN? Photograph: Rebecca Blackwell/AP
The UN spends billions of dollars each year buying goods and services for peacekeeping, humanitarian and development projects around the world. In the UK, this has made the global body a key target for the government's aid-funded business service, which seeks to connect British companies with the lucrative business opportunities offered by development finance.
The share of UN business going to rich countries has long been a source of contention for developing countries. Two general assembly resolutions, in 2005 and 2007, pushed the UN to increase opportunities for firms from developing and transition economies to win its contracts.
In 2006, China and the G77 group of developing countries "noted with dismay" the small share of UN business going to the majority of member states.
So who's doing business with the UN? And how have things changed over time? Last week the largely low-profile UN office for project services (Unops) uploaded five years and $56bn worth of UN procurement data, making it possible – for the first time – to closely examine and monitor how the UN system spends its money.
Highlights from the data:
• In 2011 UN organisations spent $14.3bn buying everything from food and medicines to transport and construction services – down from $14.5bn in 2010 but still significantly higher than the $10.1bn spent in 2007.
• Developing and emerging economies, led by India (5.1%) and Russia (4.2%), are gaining a growing share of this business. Indian firms sell goods to UN agencies, notably vaccines, pharmaceuticals and medical equipment. Russian companies primarily sell air transport services and food supplies.
• In 2011, procurement from developing and emerging countries increased by $126m, bringing their share of UN business to 58.7%.
• The US is still the top supplier of goods and services to the sprawling UN system, providing 10% of the total last year.
• Some UN agencies buy more from developing countries than others. The UN development programme (UNDP), for example, buys 79% of its goods and services from developing and emerging economies, while the UN children's fund (Unicef) buys less than 40% from them.
• The UK sold £417m in goods and services to the UN last year, down from £490m in 2010 but up by 40% from $295m in 2007.Unops says it is "committed to ensuring fair and equitable access to the UN market" and has tried to support developing country firms through outreach and capacity-building programmes, simplifying its vendor registration procedures, improving access to tender opportunities through an online portal, and restructuring bidding to make it easier for small and medium-sized enterprises to participate.
In addition, it says, the industrial sectors of many developing and emerging economies have become more competitive since 2005, which can help explain their growth in the UN market.
The UN has been tainted by high-profile procurement controversies in the past – from the Oil-for-food scandal to suspicions of collusion and price inflation in procurement for peacekeeping operations.
Previously, data on UN procurement was included in annual reports, published as pdfs, making it difficult to extract, explore and analyse.
Vitaly Vanshelboim, Unops deputy executive director, said the data release was part of the organisation's broader commitment to transparency. "The more all stakeholders can see and understand how development funds are used, the greater the chance is that these limited resources will be used effectively," he said.
Unops has published further details of its own contracts – including supplier names and the purpose of awarded contracts – on a dynamic feed updated every 24 hours, and geo-coded information on the over 1,000 projects it supports around the world.
The full data is below. What can you do with it?
Data summary
Well, colleagues, readers, followers and all others who have stopped by, please don't ever stop thinking that the UN is, as are all government and intergovernmental bodies, a political animal which gives its fiscal love to the highest bidder, the squeaky wheel or the most attractive (and "politically correct") guest at the latest fund-raiser.
This does not offset the good that the UN does in terms of humanitarianism, it just shows that there are other aspects to UN that warrant some scrutiny and open analysis.
As always, thank you for reading me, and for retweeting me.
Douglas E. Castle


No comments:
Post a Comment